





Question 77 · LEK · Basics of medical statistics
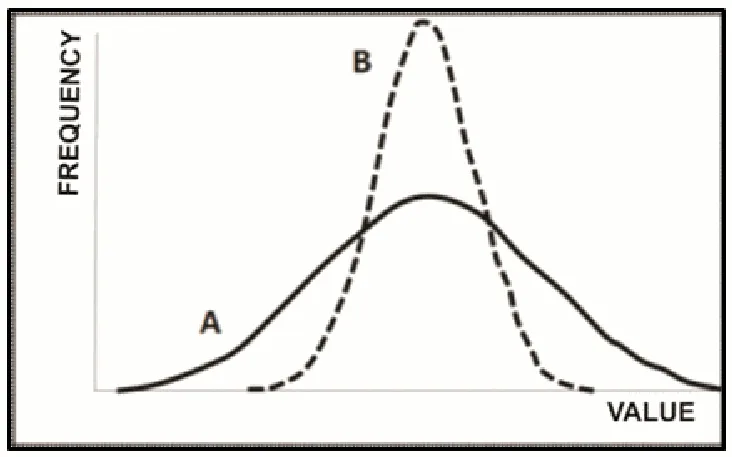
The diagram shows two distributions of the same characteristic among adult population of the towns A and B. The difference between these distributions can be numerically expressed with the use of:
- A. the median.
- B. arithmetic mean.
- C. the mode.
- D. standard deviation.
- E. number of adult inhabitants of towns A and B.
Hint
Compare the two curves: do they differ more in where their centre lies or in how widely the values are spread?
The answer, the explanation and a note on every option are available once you log in. The account is free: topic tests, a mock exam, mistake review and statistics.
More questions on Public health
- A study was conducted that aimed to identify the risk factors for SARS-CoV-2 infection among physicians. From the population of physicians in…
- Mounting scientific evidence supports the hypothesis that the postal code is a better health predicting factor than the genetic code. This…
- The use of variolisation in the past was associated with the spreading of:
- In accordance with the Act on Preventing and Combating Infections and Infectious Diseases in Humans in Poland, persons subject to compulsory…
- Which of the following is the document stipulating the rules of health promotion actions in the fight against the epidemic accumulation of diseases…
- The first international treaty on evidence-based public health, accepted by over 170 United Nations countries is: